B2B SaaS Pitch Deck: How to Build One in 2026


B2B SaaS investors read decks differently from general startup investors. They are not just evaluating market size and growth potential. They are looking for ICP precision, a GTM motion aligned with the ACV, and a metrics layer that demonstrates the business compounds. If the deck does not clearly address those dimensions, the meeting ends before the product gets a fair hearing.
This guide explains how to build a B2B SaaS pitch deck that holds up in real investor conversations. It covers what makes a B2B SaaS deck structurally different, the 13 slides that matter most, the ICP and metrics work that separates funded decks from rejected ones, and the mistakes that quietly end fundraising rounds before they start.
IN THIS GUIDE • What makes a B2B SaaS pitch deck different from a general startup deck • The 13 slides every B2B SaaS deck needs, with B2B-specific guidance for each • The ICP slide: the most skipped and most questioned slide in every B2B raise • The 2026 benchmark table for eight key B2B SaaS metrics • Stage-specific guidance: what changes at pre-seed, seed, and Series A • Real examples worth studying and the lesson each one teaches • Common mistakes that kill B2B SaaS fundraising rounds |
If you are new to SaaS pitch decks altogether, start with the SaaS pitch deck guide first. This article is the B2B-specific layer on top of that foundation.
What Makes a B2B SaaS Pitch Deck Different
A B2B SaaS deck is not a general SaaS deck with "enterprise" added to the TAM slide.
It is a different persuasion exercise. A consumer SaaS founder pitches adoption and retention at scale. A B2B SaaS founder pitches a specific customer, a specific workflow, a specific sales motion, and a specific set of metrics that prove the business compounds without losing money in the process.
Three things are unique to B2B SaaS fundraising - and three things most decks get wrong:
ICP precision. Investors scrutinize the customer far more aggressively than in consumer deals. "SMBs" is not an ICP. "Finance operations managers at Series B fintech companies with 50 to 200 employees" is. Every downstream slide - market size, GTM, competition, financials - depends on this being right.
GTM motion matched to ACV. B2B decks have to show how deals actually close: who initiates, who approves, how long it takes, and whether that motion is repeatable without the founder in the room. A $200/month product sold through a 90-day enterprise sales cycle is a contradiction in business models. Investors find it.
A metrics layer investors can read. B2B SaaS investors run four numbers before they read anything else: NRR, magic number, logo churn, and CAC payback. If those numbers are missing from the deck, the founder has already lost credibility before the first meeting.
B2B SaaS investors are not just evaluating whether the product works. They are evaluating whether the customer is real, whether the sales motion makes economic sense, and whether the business compounds. Build the deck around those three questions.
The 13 Slides Every B2B SaaS Pitch Deck Needs
This is the core structure. Each slide has a B2B-specific note: what investors are looking for, and what founders typically get wrong.

1. Cover
Company name, a one-line description of what it does and who it is for, your logo, and contact details.
B2B-specific note: State clearly who the customer is in the tagline itself. "The contract management platform for mid-market legal teams" is a cover slide. "AI-powered legal workflow automation" is not. Seven words that name the buyer and the outcome replace ten slides of context.
2. Problem
A specific workflow pain point, felt by a named persona, quantified in terms of time, money, or headcount.
B2B-specific note: The strongest B2B problem slides describe a friction that is structural to how businesses operate today - not just a product gap. Frame the problem in terms of the workflow, then show why existing solutions fail that specific buyer. Investors expect you to have spoken to at least 20 potential customers before building this slide. If you have not, the problem statement will feel borrowed rather than earned.
3. Solution
Show the product. A screenshot, a 30-second demo embed, or a single example use case.
B2B-specific note: If the product is live, show real screens - not polished renders that look nothing like the current state. If you are pre-launch, mockups are fine, but label them clearly. Investors recognize the difference immediately. Do not list features. Show the outcome for the buyer.
4. ICP and Market Definition
This is the slide most B2B SaaS decks skip entirely, and it is the one investors push back on most.
Define your ICP with five dimensions: company size, sector, tech stack or buying context, the economic buyer's title, and the triggering event that makes them start looking. Then state how many companies fit that profile. That number is your real addressable market.
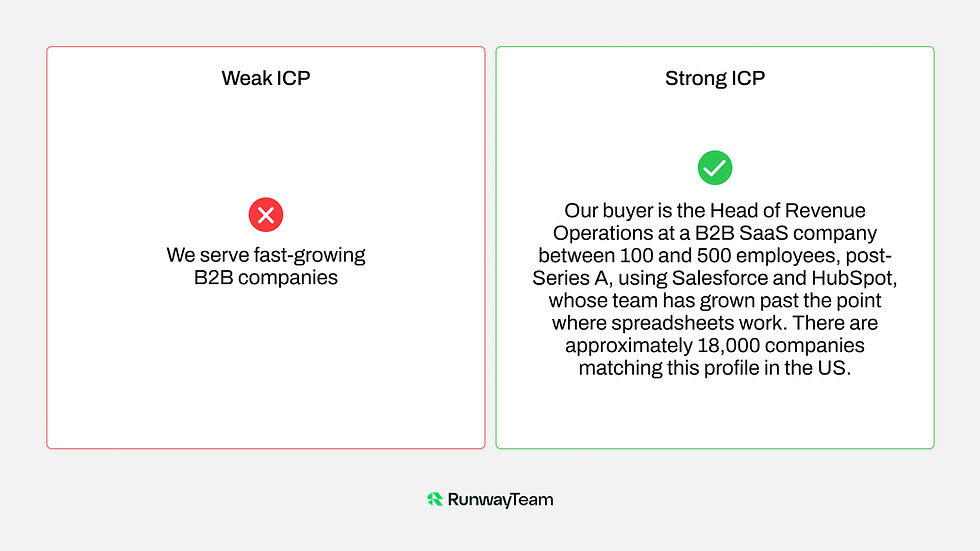
B2B-specific note: A strong ICP slide sounds like: "Our buyer is the Head of Revenue Operations at a B2B SaaS company between 100 and 500 employees, post-Series A, using Salesforce and HubSpot, whose team has grown past the point where spreadsheets work. There are approximately 18,000 companies matching this profile in the US." A weak one sounds like: "We serve fast-growing B2B companies." If the ICP is vague, every downstream slide - market size, GTM, competition - loses credibility.
5. Market Size
Bottom-up only.
Take the ICP count from the previous slide. Multiply by your realistic ACV. Apply a conservative penetration rate over 36 months. That is your SOM, and it is the number investors care about at the early stage. See the market size slide guide for the full methodology.
B2B-specific note: "The global enterprise software market is $700B - we are targeting 1%" is the fastest way to lose credibility in a B2B investor meeting. They know the number, and it tells them nothing about your opportunity. Show the specific ICP account count, the ACV, and the reachable share over 36 months. That calculation is defensible. The top-down TAM is not.
6. Product and Differentiation
Outcomes, not features.
B2B-specific note: Pair each product capability with a measurable result for the buyer. "Automated reconciliation" is a feature. "Reduces month-end close from 12 days to 3" is a reason to buy. Add one comparison row: what the customer's workflow looks like today versus what it looks like with your product. This does more work than any competitor matrix.
7. Traction and Metrics
This is the slide investors reopen after the first read. For a B2B SaaS company, the traction slide is not a logo wall and a user count. It is a story told in four signals: ARR or MRR trend over 12 months, NRR, logo churn, and CAC payback.
B2B-specific note: If you have all four signals, show all four. If you are pre-revenue, substitute: design partner contracts, signed LOIs, pilot conversion rate, and cohort retention from the first 10 customers. The mistake is reporting what looks good. Investors will eventually see the real cohort data. If the deck hides it, the diligence call will be the last one.
8. Business Model
How money comes in, how it grows, and what a deal looks like.
B2B-specific note: Cover pricing structure (per seat, usage-based, tiered, or hybrid), ACV across tiers, and the expansion logic. If your model is land-and-expand, show the expansion curve from your first cohort: what the average account looks like at month 6, month 12, and month 24. If pricing depends on enterprise sales but your traction slide shows self-serve signups, those two slides contradict each other. Investors notice contradictions immediately.
9. Go-to-Market
One motion, owned clearly.
B2B-specific note: The ACV determines which GTM motion is credible. Under $5K ACV: PLG - self-serve trial, activation rate, time-to-first-value. Between $5K and $50K ACV: hybrid motion - PLG top-of-funnel with a short inside sales cycle. Above $50K ACV: enterprise sales - champion identification, multi-stakeholder close, average sales cycle length, win rate. Investors distrust founders who claim all three motions simultaneously. Two named closed deals from outbound are worth more than a slide listing four theoretical channels.


10. Competition
A 2×2 or a feature comparison table. Not both.
B2B-specific note: Include modern B2B SaaS competitors and legacy incumbents. Spreadsheets, manual processes, and internal tools all count - they are the status quo your customer has to abandon to buy from you. Show where you defensibly win without claiming to be best in every dimension. Defensibility in B2B SaaS is structural: proprietary integrations, switching costs from embedded workflows, data network effects, or regulatory compliance moats.
11. Team
Domain expertise and operator track record.
B2B-specific note: Enterprise sales wins, named accounts closed, and domain-specific exits carry more weight in a B2B deck than in a consumer one. Investors backing a B2B SaaS company want to know that the founder has sold to the ICP before, or has been the ICP. Two to three sentences per founder. If the team is light on B2B sales experience, name the first two hires and the advisors who fill that gap.
12. Financials and Use of Funds
Three numbers and a clear plan.
B2B-specific note: Burn rate, runway in months, and a 24-month ARR milestone tied to the raise. Show the rough allocation: product, sales, and hiring. Then close with one specific sentence: "Raising $3M seed to reach $1.5M ARR, hire two enterprise AEs, and achieve CAC payback under 18 months by Q2 2027." Specific is fundable. Vague is not.
13. Ask
Round size, instrument, and lead status. One sentence on what the round enables and the metric that triggers the next raise.
B2B-specific note: "Raising a $3M SAFE at a $15M cap. $1.2M committed. Round closes [date]." If you do not have a lead, say so honestly. Investors know when that line is fabricated.
Each slide in a B2B SaaS pitch deck has one job: answer the investor's next question before they have to ask it. In B2B SaaS, that next question is almost always about the ICP, the GTM motion, or the metrics. Build every slide around those three questions.
The ICP Slide: The Most Skipped and Most Questioned Slide in Every B2B Raise
The ICP slide is where most B2B SaaS fundraisers quietly lose momentum.
Investors push back on ICP for a simple reason: if you do not know precisely who you are selling to, you cannot tell them how you will find more of them, what it costs to acquire them, how long they will stay, or whether the market is large enough to matter. Vague ICP collapses every downstream number.
A credible ICP slide addresses four things clearly:
Named Buyer Profile
Not a segment - a person. Title, company stage, company size, sector, and the specific condition that makes them ready to buy. The "triggering event" is the element most decks omit. Investors want to understand not just who buys, but what changes in a buyer's world that make them start looking.
Five-Dimension Definition
Company size, sector, tech stack, or buying context, economic buyer's title, and the triggering event. Founders who can articulate all five have done the discovery work. Investors can tell the difference between an ICP built from real closed deals and one invented during ideation.
Account Count
State how many companies match the profile in your primary market. That number turns the ICP slide into a market-sizing tool: ICP count × ACV × reachable share = SOM. If that number is not on the ICP slide, it needs to be on the market size slide immediately after.
Evidence Source
The strongest ICP slides are built backward from actual closed deals. Pull the last 10 customers who signed. Find the two or three attributes they share. That is your real ICP. An investor will believe it because it is grounded in evidence rather than theory.
If your ICP slide is vague, your competition slide will be incoherent, your TAM will be undefendable, and your go-to-market will have no anchor. The ICP slide is the load-bearing wall of a B2B SaaS deck.
B2B SaaS Metrics: The 2026 Benchmark Table
The metrics slide is where most B2B SaaS rounds are won or lost.
Investors who fund B2B SaaS use a specific set of benchmarks. They know the numbers. If yours are below benchmark and you present them without context, investors fill the silence with their own interpretation. Always present the benchmark, your number, and your trend line. Context is not weakness. It is operator sophistication.
NRR | 105-115% | 120%+ | Bar chart by cohort year. Trend matters more than the snapshot. |
Logo churn | < 2% / month | < 1% / month | Single number with a 12-month trend line. |
CAC payback | < 18 months | < 12 months | Formula: CAC ÷ (ACV × gross margin). |
Gross margin | 70–75%+ | 80%+ | Single percentage with a note on infrastructure costs. |
Magic number | > 0.75 | > 1.0 | Net new ARR ÷ prior quarter S&M spend × 4. |
Rule of 40 | 40%+ | 60%+ | Growth rate % + profit margin %. Mainly a Series B+ signal. |
LTV:CAC | 3:1 | 5:1+ | 3-year LTV cap. Unlimited LTV math signals inexperience. |
Burn multiple | < 2.0 | < 1.5 | Net burn ÷ net new ARR. Capital efficiency shorthand. |
What Each Metric Actually Signals
NRR. The single metric that determines B2B SaaS valuation multiples more than any other in 2026. Private B2B SaaS companies trade at 3× to 7× ARR broadly. Companies with NRR above 120% command the top of that range. If NRR is above 100%, lead with it on the metrics slide. If it is below 100%, have a narrative ready: investors will ask in the first email.
Magic number. The metric that has moved most in investor expectations since 2022. In the zero-interest era, investors tolerated magic numbers below 0.5. In 2026, a magic number below 0.75 triggers immediate questions about the sales motion. At or above 1.0, it signals that scaling sales spend will produce proportional returns - exactly what a Series A is designed to fund.
Burn multiple. Net burn divided by net new ARR. A burn multiple below 1.5 means you are generating nearly as much new ARR as you are spending to acquire it. It has become the capital efficiency shorthand that investors use at Series A and beyond.

Do not present metrics in isolation. Show the benchmark, show your number, and show the direction. NRR improving from 98% to 108% over two quarters is a stronger signal than 108% sitting flat for 18 months.
What Changes at Each Funding Stage
The 13 slides stay the same. What goes inside them changes completely.

Pre-seed
At pre-seed, investors are buying the thesis and the team. They are not buying a proven business.
Replace ARR with ICP validation: 20 or more customer discovery interviews, 3 to 5 signed design partner agreements with companies matching the ICP definition, and a pilot conversion hypothesis tied to the pilots currently in progress.
The most common pre-seed mistake: spending six slides on the product and one sentence on the team. At this stage, the team is the product. Domain expertise and the ability to sell to the ICP are what investors are actually underwriting.
Seed ($0 to $1M ARR)
At the seed, show the first proof that the thesis is right.
Include ARR trend even if the numbers are small - the slope matters more than the absolute value. Show NRR from the first cohort, even if that cohort is 8 customers. Clarify the ICP based on who is actually paying, not who you hoped would pay. Those two things are often different, and investors respect founders who have made that adjustment.
The most common seed mistake: listing 10 use cases across 5 verticals instead of owning a single ICP. Breadth at seed signals a company that has not found product-market fit. Depth signals one that has.
Series A ($1M to $5M ARR)
At Series A, investors are buying a working engine, not a working hypothesis.
The traction slide carries the round. Show: a repeatable sales motion with conversion rates and sales cycle length, ARR trend with a clear year-over-year growth rate, NRR above 100%, CAC payback under 18 months, and a team that has hired its first sales and customer success leaders.
If the founder is still closing every deal personally, that is a risk signal, not a success signal. The most common Series A mistake: a strong ARR number without cohort retention data. Investors are backing into the NRR from the ARR trend. If the two numbers do not reconcile, they know.
B2B SaaS Pitch Deck Examples Worth Studying
Founders often search for B2B SaaS pitch deck examples to understand what funded decks look like. Examples are useful, but they mislead more often than they help.
Most public deck PDFs were shared after the raise, edited for narrative polish, and stripped of the elements that created investor conviction in the actual meeting: the founder's ability to answer hard questions about ICP and metrics, and the on-the-ground sales evidence that made traction claims believable.
That said, these six decks are worth studying for their structural logic and what each one teaches about B2B-specific fundraising:

The pattern across all six: ICP precision made every other slide more credible. Founders who knew exactly who they were selling to could defend the market size, the GTM motion, and the unit economics from first principles. Founders who did not know could not.
Common Mistakes That Kill B2B SaaS Pitch Decks
These are the patterns most common in B2B SaaS decks that do not get a second meeting.
Vague ICP
"Mid-market companies" is not a customer. Investors will ask "which ones?" in the first email. If the answer requires a five-minute explanation, the ICP slide failed its job. Every other slide depends on the ICP being specific - when it is not, the whole deck loses credibility simultaneously.
Top-down TAM with no bottom-up SOM
"We are targeting 1% of a $50B market" with no underlying account math is not an analysis. It is a hope. Investors reject it quietly and move on. Use ICP count × ACV × reachable share; the result becomes defensible.
No GTM motion defined
Listing four acquisition channels without evidence for any of them signals that the founder has not decided how to sell. At pre-seed and seed, this is survivable. At Series A, investors expect a sales motion that is already working and does not require the founder to be in every call.
Metrics without benchmarks
NRR of 107% on a slide with no context tells an investor nothing about whether that is good or bad for your stage, sector, and ACV. Show the benchmark. Let the number speak against it. Selective context - showing only the metrics where you beat the benchmark - is noticed immediately.
Vanity metrics alongside real metrics
Presenting website visits alongside ARR, or registered users alongside paying customers, creates noise that obscures the real numbers. It signals that the founder is padding the deck because the real metrics are thin. Show only the metrics that tie directly to the business model.
No "why now"
B2B SaaS companies can exist for years before the market is ready to fund them. The deck needs a specific reason why 2026 is the right moment: a regulatory shift, an infrastructure change, a distribution unlock, or a customer budget cycle that did not exist 18 months ago. "The market is large and growing" is not a why now.
The strongest B2B SaaS pitch decks are built around investor logic, not founder conviction. Conviction is assumed. ICP precision, a matched GTM motion, and benchmarked metrics are what move the conversation forward.
Build a B2B SaaS Pitch Deck That Holds Up to Investor Scrutiny
Most B2B SaaS pitch decks look the same. They follow the same template, make the same market-size arguments, and treat ICP and GTM as slides to fill rather than as arguments to make.
The ones that raise capital are built differently. They define the ICP based on actual closed deals, align the GTM motion with the ACV, and present every metric in context relative to 2026 benchmarks. They are built around the questions investors actually ask, not the ones founders hope they will ask.
At RunwayTeam, we work with B2B SaaS founders at pre-seed and seed stage to build pitch decks and financial models that hold up in real investor conversations. If you are raising for a B2B SaaS startup and want a deck built around your specific ICP, metrics, and sales motion, let's talk.
Frequently Asked Questions
How many slides should a B2B SaaS pitch deck have?
Thirteen slides for a standard investor deck: cover, problem, solution, ICP and market, market size, product, traction and metrics, business model, go-to-market, competition, team, financials, and ask. A deck longer than 15 signals the founder has not made editorial decisions. A deck shorter than 10 is usually missing something investors will ask for in the first meeting.
What metrics do B2B SaaS investors care most about in 2026?
NRR, CAC payback, magic number, logo churn, and gross margin. NRR is the single metric that most directly predicts valuation multiples. A magic number above 0.75 signals sales efficiency. CAC payback under 18 months signals a sustainable acquisition. A gross margin above 70% signals the software margin is intact and not being eroded by services or infrastructure.
How is a B2B SaaS pitch deck different from a general SaaS pitch deck?
Three differences: the ICP slide (B2B investors require a specific customer definition, including company profile and buying trigger), the GTM motion slide (B2B investors want to see a sales motion that matches the ACV, not a list of channels), and the metrics layer (B2B SaaS investors run NRR, magic number, and logo churn before they read anything else). A general SaaS deck can survive without these. A B2B SaaS deck cannot.
What should I put on the ICP slide of a B2B SaaS deck?
Five things: company size (revenue or headcount), sector, relevant technology context or buying trigger, the economic buyer's title, and the total number of companies matching that profile in your primary market. The last element turns the ICP slide into a market-sizing tool, making the next slide credible.
What GTM motion should I show in my B2B SaaS deck?
The motion that matches your ACV and your existing evidence. Under $5K ACV: PLG. Between $5K and $50K ACV: hybrid PLG and inside sales. Above $50K ACV: enterprise sales with champion-driven close. Show the evidence you have for the motion you choose. Two closed deals from outbound are stronger than four theoretical channels.
What NRR is good enough for a B2B SaaS seed round?
At seed, NRR above 100% is strong. NRR between 90% and 100% is manageable if you have a narrative for the trend - churn concentrated in early non-ICP customers who have since been replaced by ICP-fit accounts. An NRR below 90% at the seed will produce questions in every meeting. The trend matters more than the snapshot.
How do I pitch a B2B SaaS startup if I do not have ARR yet?
Shift the traction slide to qualitative signals: signed design partner agreements, paid letters of intent, pilot conversion rate, and cohort retention from the first 10 to 20 users. The ICP slide does more work in a pre-revenue deck - it is the proof that you have spoken to the customer and understand the workflow precisely. Customer discovery depth substitutes for revenue depth at the pre-seed stage.
What do investors mean by the magic number in a SaaS pitch deck?
Sales efficiency. The formula: net new ARR for the quarter × 4, divided by sales and marketing spend in the prior quarter. Above 0.75 means the sales engine generates more revenue than it costs to run. Above 1.0 means scaling sales spend will produce proportional returns. Below 0.5 means the sales motion is not working at its current cost level.